Class 12 Artificial Intelligence – Data Science Methodology
1. What is data science methodology?
It provides a structured way to collect, process and understand data.
2. Name different modules of Data Science methodology.
There are five modules of Data Science methodology
- From Problem to Approach
- From Requirements to Collection
- From Understanding to Preparation
- From Modelling to Evaluation
- From Deployment to Feedback
3. Explain five modules of Data Science methodology.
i. From Problem to Approach:
- First, we find out what problem we want to solve using AI.
- We try to understand where the problem comes from (like school, shop, or hospital).
- We set clear goals and focus on one problem at a time.
- We choose a method like machine learning or deep learning to solve it.
ii. From Requirements to Collection:
- What data is needed to solve the problem.
- We check what type of data we need, how much, and where to get it.
- We can get data from inside (like company files) or outside (like websites).
- Good data is important to make the AI work well.
- We also write down how and where we got the data.
iii. From Understanding to Preparation
- We look at the data to understand it.
- We fix any mistakes, remove extra parts, and fill in missing things.
- We pick useful parts of the data to help the model learn better.
- We change the data into the right form for training.
- Now the data is ready to be used.
- This step ensures that the dataset is ready for modeling.
iv. From Modelling to Evaluation
- We choose the right AI method to build the model.
- We split the data into two parts: one for learning, one for testing.
- We train the model and check how good it is using scores like accuracy.
- We try different models to see which one works best.
- We make small changes to improve the model.
v. From Deployment to Feedback
- We use the model in real life.
- We watch how it works and if it does a good job.
- People give feedback and we check the results.
- If needed, we fix or train the model again to make it better.
- This keeps the model helpful for a long time.
4. Explain Descriptive Analytics method?
It method is used to identify trends and patterns on the basis of past data. It is the process of understanding that has happened.
5. Explain different methods of Descriptive Analytics.
- Data Aggregation: Summarizing data from multiple sources.
- Data Mining: Discovering patterns in large datasets.
- Statistical Measures: Mean, median, mode, standard deviation.
- Data Visualization: Using charts, graphs, dashboards to present data trends.
- Reporting Tools: Pre-built reports and summaries.
Example: Monthly sales reports showing revenue, region-wise performance, etc.
6. Explain Diagnostic Analytics method?
It is the process of understanding why things have happened. This method is used to analyze the reason behind the patterns of data.
7. Explain different methods of Diagnostic Analytics.
- Drill-Down Analysis: Looking at data more closely, step by step, to see small details.
- Correlation Analysis: Finding out if two things are connected or move together.
- Root Cause Analysis: Finding the real reason why a problem happened.
- Data Discovery Tools: Easy-to-use tools that help you look at and understand data.
- Hypothesis Testing: Checking if an idea or guess is true by using math and data.
Example: Analyzing customer feedback to understand why complaints increased.
8. Explain Predictive Analytics method?
It is the process of understanding what will happen in the future on the basis of past data.
9. Explain different methods of Predictive Analytics.
- Regression Analysis: Predicting future on the basis of historical trends of data.
- Machine Learning Models: Decision trees, neural networks, support vector machines.
- Time Series Analysis: Forecasting future values using time-based data.
- Classification: Categorizing data into groups
- Clustering: Grouping similar data together.
Example: Predicting customer return based on usage patterns.
10. Explain Prescriptive Analytics method?
It is the process to decide what should be done after making predictions
11. Explain different methods of Prescriptive Analytics.
- Optimization Algorithms: Linear programming, genetic algorithms.
- Simulation: Modeling scenarios to evaluate different decisions.
- Decision Analysis: Tools to evaluate possible outcomes of decisions.
- Recommendation Engines: Suggesting actions using AI and ML.
Example: Suggesting the best delivery routes to minimize cost and time.
12. What do you mean by understanding data requirements?
It is the process of clearly defining what kind of data is needed to solve a problem.
13. Explain steps in understanding data requirements:
- Identifying data types: Quantitative (numbers), textual (words), and visual (images).
- Choosing data structure: Formats like tables, text files, or databases.
- Finding data sources: From company records, surveys, websites, sensors, or public datasets.
- Preparing data: Cleaning and organizing to remove errors or duplicates.
14. Explain different types of data.
- Structured Data: It is organized in fixed format e.g. databases.
- Semi-Structured Data: It is not fully organized, e.g., emails, XML.
- Unstructured Data: No fixed format, e.g., social media posts, videos.
15. What is 5W1H?
5W1H stands for: What, Why, When, Where, Who and How
i. What?
Ask: What happened?
What is the problem or task?
Example: What is the issue we are trying to solve?
ii. Why?
Ask: Why did it happen?
Why is this important?
Example: Why is it a problem?
iii. When?
Ask: When did it happen?
When should something be done?
Example: When did the issue begin?
iv. Where?
Ask: Where did it happen?
Where does it affect?
Example: Where did the mistake take place?
v. Who?
Ask: Who is involved?
Who is affected or responsible?
Example: Who is part of the problem or solution?
vi. How?
Ask: How did it happen?
How can it be fixed or improved?
Example: How can we solve it?
16. Explain 5W+1H framework for a grocery store that wants to avoid stock shortages by predicting demand.
| Question | Answer |
|---|---|
| What | We want to predict the demand for grocery items. |
| Why | To avoid running out of stock and losing customers. |
| When | Especially during weekends, holidays, and sale days. |
| Where | In all store locations, especially busy ones. |
| Who | Store managers, supply chain team, and data analysts. |
| How | By studying past sales data, seasonal trends, and using AI or data analysis tools. |
17. Explain 5W +1H framework for Delayed Delivery of Online Orders.
| Question | Answer |
|---|---|
| What | Orders from customers are being delivered late. |
| Why | The delivery service is facing delays due to traffic and driver shortage. |
| When | This issue started last week and occurs mainly on weekends. |
| Where | The deliveries are being delayed in the city areas, especially in the evening. |
| Who | The delivery team, logistics department, and customers are affected. |
| How | The delivery service is not properly scheduled, and there is a lack of enough drivers for peak hours. |
18. Explain 5W +1H framework for Low Employee Productivity.
| Question | Answer |
|---|---|
| What | Employees are not meeting productivity goals. |
| Why | Employees are feeling demotivated due to unclear work expectations and lack of feedback. |
| When | The problem has been noticed over the past month. |
| Where | It’s happening in the marketing and customer service departments. |
| Who | Employees, team managers, and HR department are involved. |
| How | There is no regular check-in with team leaders, and there’s little recognition of achievements. |
19. Explain 5W+1H framework for Decreasing Sales in a Clothing Store
| Question | Answer |
|---|---|
| What | Sales at the clothing store are decreasing. |
| Why | Customers are not finding the latest fashion trends, and prices have increased. |
| When | The sales began to drop over the last two months. |
| Where | The store’s sales are particularly low in the downtown location. |
| Who | The store manager, marketing team, and customers are involved. |
| How | The store has not updated its inventory to reflect new trends and customers are also hesitant due to the price hike. |
20 What challenges might arise while defining data requirements?
- Incomplete Data – Some important information may not be available.
- Data Privacy Issues – Collecting data of customers as per privacy laws.
- Data Overload – Too much data may slow down processing and make analysis difficult.
21. What do you mean by Data collection
It is the process of gathering relevant data needed to train, test, and validate an AI model.
22. What do you mean by Primary Data?
Primary data refers to the data collected directly from original sources.
23. What are sources of Primary Data?
- Surveys and Questionnaires: Used to gather opinions or feedback.
- Interviews and Focus Groups: Useful for in-depth understanding of user needs.
- Sensors and IoT Devices: For real-time data like temperature, motion, etc.
- Manual Observations: For analyzing behavior or activities.
- Mobile Apps or Websites: Collecting user interaction data.
24. What do you mean by Secondary Data?
Secondary data refers to data that is already available, collected by others for different purposes.
25. What are sources of Secondary Data?
- Books, Research papers and journals
- Websites and Online databases
- Company databases and records
- News articles, blogs, social media data
26. What do you mean by Mixed Data?
Mixed data sources combine both primary and secondary data to create a more comprehensive and reliable dataset.
27. What are sources of Mixed Data?
Online Marketing Analytics : Data is collected from user surveys, experiments and existing reports.
Online Tracking: Data is collected from first hand analytic tools and Google trends.
Social Media Monitoring: Data is collected from social media platforms.
Online Tracking (Primary): Data collected directly by you, like website visits from your own tools.
Online Tracking (Secondary): Data taken from outside sources, like Google Trends.
Combination Research: Uses both self-collected data and existing information for better insights.
Social Media Monitoring (Primary): Directly tracking user activity on your own social media pages.
Social Media Monitoring (Secondary): Using reports or data summaries from external sources.
28. What is the role of data collection in a project?
- Collaboration: Data scientists, DBAs, and programmers work together to collect data from both direct (primary) and outside (secondary) sources.
- Iteration: If something is missing or unclear, the team may collect more data or make changes.
- Accuracy & Reliability: Good decisions in areas like business, health, education, and research depend on having correct and complete data.

29. For the clothing showroom inventory management problem, analyze the following questions:
a) What are the possible sources for collecting this data?
a. Primary Data Sources (Showroom sales records, Customer feedback or surveys)
b. Secondary Data Sources (Sales data of other clothing stores, fashion industry databases)
Ans. Both a. and b.
b). How can the collected data be categorised for better organization?
Ans. By categorising data correctly as structured data, semi-structured data and unstructured data. This makes it easier to analyse and use for decision-making.
c). What challenges might arise during the data collection process?
Ans. Challenges during the data collection process are as follows:
- Missing Data – Some key details (like customer style preferences or size demands) may not be available.
- Privacy Issues – Customer data collection must comply with data protection laws.
- Inconsistent Data Formats – Data may come from different sources and need standardization.
- Data Overload – Too much data may slow down processing and require additional storage.
30. What is the meaning of Data Understanding?
Data understanding means checking the data to make sure it is correct, complete, and useful for solving the problem. It helps us to see if the data is good enough or if we need to collect more data.
31. Why is Understanding Data Important?
- It makes sure the data matches the problem we are trying to solve.
- It helps us find mistakes, missing information, or data we don’t need.
- It helps us decide if we need to collect more data.
- It gives us clean and useful data for better decisions.
32. What are the Different Ways to Analyze the Data?
i. Descriptive Statistics – These help us describe the data.
- Mean, Median, Mode – To find the average or most common value.
- Range, Variance, Standard Deviation – To see how different the values are from each other.
- Pairwise Correlation – To check if two things are connected (like: do bigger discounts lead to more sales?).
ii. Data Visualization – Drawing charts or graphs to see patterns:
- Histograms – Show how often values appear.
- Pie Charts and Bar Graphs – Compare different groups.
- Scatter Plots – Show how two things are related.
iii. Handling Missing Data – Deciding what to do if some data is not there.
- Finding Mistakes or Duplicates – Removing wrong or repeated data.
Identifying Outliers – Finding values that are very different from others, which may show a mistake or something special.
33. What is the Meaning of Data Visualization?
Data visualization means showing data in pictures or graphs. It helps us quickly see patterns, trends, and relationships in the data. This makes it easier to understand and explain the data.
34. What Are the Different Techniques of Data Visualization?
- Histograms – Show how often different values appear.
- Pie Charts – Show how a whole is divided into parts.
- Bar Graphs – Help compare different categories.
- Scatter Plots – Show the relationship between two variables.
35. What Are the Different Techniques to Clean the Data?
- Handling Missing Data – Fill in missing values using methods or collect more data.
- Detecting Errors and Duplicates – Find and fix wrong or repeated data.
- Identifying Outliers – Check for unusual values that may be mistakes or need special attention.
Q36. How can you check if the collected data is complete, and correct?
We can check data quality by:
- Identifying missing data – Checking if important details are missing.
- Detecting duplicates – Removing duplicate records .
- Verifying accuracy – Ensuring that data values are correct.
- Cross-checking with external data sources
Q 37. Can a correlation analysis help in grocery store?
Ans. Yes, correlation analysis can help. It shows how two things are related to each other.
For example:
- If more customers visit the store, do the sales go up too?
- Does bad weather cause more people to buy packaged food?
Q 38. What do you mean by data preparation?
Ans. Data preparation means organizing and cleaning raw data before using it. This step makes data easier to understand and use in data analysis or machine learning. The main steps are:
- Cleaning Data – Fixing or removing missing values, duplicate entries, and formatting errors.
- Combining Data – Joining data from different sources like tables or files.
- Transforming Data – Changing raw data into useful information for analysis.
- What is Feature Engineering?
Q 39. What do you mean by feature Engineering?
Feature engineering means creating or changing data to make machine learning models more accurate.
Q 40. How can feature engineering help in building model to predict students’ performance?
If you’re building a model to predict students’ performance , raw data may include things like study hours, attendance, and number of assignments submitted by the students. New features can be created such as :
- Study-to-assignment ratio = Study hours ÷ Assignments submitted
- Assignment submission percentage = (Assignments submitted ÷ Total assignments) × 100
- Consistency Score = (Attendance % × Assignment submission %) ÷ 2
- Engagement Score = A mix of attendance, study hours, and assignment scores
Q41. Why is Data Preparation Important?
Data preparation is important because it makes sure the data is clean and ready to use. If this step is skipped, machine learning models might give wrong results.
- It takes the most time (about 80% of the total time in a project).
- It’s used across industries, since many problems need similar steps.
- Automation helps – Tools powered by AI can do data preparation faster by reducing manual work.
Q42. Case Study: Beverage Sales Analysis
For the given sample dataset of beverage sales data for three months, answer the following questions:
| Month | Tea Sale | Coffee Sale | Juice Sale | Beverage Products | Sale of Tea | No. of school holidays | Weather | Promotion Applied |
|---|---|---|---|---|---|---|---|---|
| Jan | 200 | 180 | 150 | 250 | 200 | 3 | Cold | Yes |
| Feb | ? | 160 | ? | 300 | 200 | 5 | Moderate | No |
| Mar | 180 | ? | 170 | 280 | ? | 2 | Hot | 35 |
a. Is there any duplicate data?
Ans: Yes, the columns “Tea Sale” and “Sale of Tea” show the same information. If they are not different, one of them should be removed to avoid confusion.
b. Is there any incorrect data?
Ans: Yes, in the “Promotion Applied” column, the value “35” (in March) is wrong. The column should contain “Yes” or “No”.
c. Is there any missing data?
Ans: Yes, some values are missing:
- “Tea Sale” for February
- “Juice Sale” for February
- “Coffee Sale” for March
- “Sale of Tea” for March
d. Are the names of columns clear, or are any changes suggested?
Ans: Some columns could be renamed:
- “Tea Sale” and “Sale of Tea” should be merged or renamed for clarity
- “Beverage Products” should specify if it includes all drinks or only some
- “Promotion Applied” could be renamed to “Promotion Status” with Yes/No values
e. Did you find any irrelevant data in the dataset?
Ans: The “No. of school holidays” may not be useful unless it affects drink sales. The value “35” in “Promotion Applied” might also be wrong or not suitable for this column.
f. What steps can be done to to clean and improve the data:
- Remove or rename repeated columns
- Correct the “35” value in Promotion Applied
- Fill in missing values using proper methods
- Clarify column names for better understanding
- Ensure all data helps in analysis and decision-making
Q43 What is AI Modeling stage?
In the modeling stage, we use the cleaned data to create models that help us understand the data and find useful information.
The type of model we choose depends on how we plan to study the data.
This process may need to be repeated, with some changes to the data, to make the model more accurate.
Data scientists often try different methods to find the best model for solving the problem.
Q44. What is Descriptive Modeling?
What it does: Looks at past data to understand what happened.
Purpose: To summarize and explain past events or behaviors.
Example: Analyzing last year’s sales data to find which month had the highest sales.
Key Question: What happened? or Why did it happen?
Q44. What is Predictive Modeling
What it does: Uses past data to guess what might happen in the future.
Purpose: To make predictions and forecast future trends or outcomes.
Example: Predicting next month’s sales based on previous years’ data.
Key Question: What is likely to happen next?
Q45. What is Model Evaluation?
It means checking how good an AI model is at making predictions.
Q46. Explain Phases of Model Evaluation
i. Diagnostic Measurement Phase :
- This phase checks whether the model is performing as per expectations or not.
- Use measures like accuracy, precision, recall, F1score, confusion matrix.
ii. Statistical Significance Test Phase
- It checks if results are real and not by chance.
- It ensures the model is reliable for real world use.
Q47. What should be done if Model Predictions are Wrong?
- Check data quality – remove errors, handle missing values, balance classes.
- Feature engineering – add/remove features, normalize data.
- Tune hyperparameters – adjust learning rate, depth, etc.
- Change algorithm/model – sometimes a different model works better.
- Use more training data – to improve learning.
Q48. How to Check if Model Works Correctly
- Split data into training & testing sets.
- Evaluate using accuracy, precision, recall, F1-score.
- Check performance on unseen/real-world data.
- Use cross-validation to ensure stability.
Q49. What is the role of Statistical Significance Test in Ensuring Reliability of AI Model?
- It ensures that the model’s results are not just luck.
- It confirms that the performance of AI model is consistent across different samples.
- It helps to compare multiple models to choose the best and most reliable model.
Q50. What should be done if AI model fails to make correct predictions?
- Re-train the model with better data.
- Perform error analysis to understand where it fails.
- Reduce overfitting.
- Combine multiple models
- If still failing → rethink problem definition/approach.
Q51 What do you mean by Deployment of AI Model? Give an example.
Deployment means making the AI model available for real-world use (outside the lab).
Example: A spam detection model deployed in Gmail to automatically classify emails.
Q52. What is Importance of Deployment
- It brings value to real users.
- It allows businesses to make data-driven decisions.
- It provides real-time predictions (e.g., recommendation systems, fraud detection).
- It helps in continuous learning & feedback.
Q53. What are Challenges in Deployment of AI Model?
- Data drift – real-world data may differ from training data.
- Scalability – model must handle large volumes of requests.
- Integration – difficulty in connecting AI with existing systems.
- Maintenance – models may need frequent retraining.
- Ethical issues – bias, fairness, and transparency.
- Performance monitoring – ensuring model accuracy doesn’t degrade over time.
Q54. What do you mean by Feedback in AI Model Life Cycle?
It is the information about how well the model is performing in real world .
Q55. What are types of Feedback in AI Model Life Cycle?
- Explicit feedback – user gives direct response (e.g., thumbs up/down, star rating).
- Implicit feedback – system observes behavior (e.g., clicks, time spent on page).
- Automated feedback – system compares predictions with real outcomes.
Q56. Why does AI model require regular updates?
- Real world data keeps changing (called data drift).
- Model performance decreases over time.
- Updates ensure accuracy, fairness, and reliability.
Q57. How can automation speed up improvements in AI Model?
- Collect new data.
- Retrain models quickly.
- Deploy updated versions.
- This makes the model improve faster with less human effort.
Q58. What should be done If predictions are repeatedly incorrect?
- Check for poor data quality.
- Do error analysis.
- Change features or algorithm.
- Add more training data.
Q59. Which step is Most time consuming step in AI Project Cycle?
Data Preparation is the most time consuming step in AI Project cycle as it includes cleaning, preprocessing and handling missing values.
Q60.What do you mean by Model Validation? Why is it needed?
It is the process of checking whether the trained model performs well on unseen data. It is needed to avoid overfitting/underfitting and ensure reliability.
Q61. What are different Evaluation Techniques?
- Overfitting – model is too complex → works well on training data but fails on test data.
- Underfitting – model is too simple → poor performance on both training & test data.
- Perfect fit – model performs well on both training and test data.
Q62. Name different types of Model Validation techniques.
- Train-Test Split
- K-Fold Cross Validation
Q63. Explain Train-Test Split Method.
The Train-Test split method is a way of checking how well an AI/ML model performs. In this method, The data is divided into two parts:
i. Training Data → It is used to train (teach) the model.
ii. Testing set → It is used to test how well the model works on unseen data.
Q64. What are steps of Train-Test Split method?
1. Take the data or dataset.
2. Split it into training and testing datasets (Example: 80:20 means 80% training data, 20% testing data)
3. Train the model using the training data set.
4. Test the model using the testing set.
5. Measure performance using metrics like accuracy, precision, recall, etc.
Q65. What is the importance of Train-Test Split?
It ensures that AI model is tested on unseen data.
It prevents overfitting.
It gives a clear idea of real world performance.
Q66. Give a real world example of Train-Test Split method.
Dataset = 1000 records.
Split = 80% training (800 records), 20% testing (200 records).
Model is trained on 800 and tested on 200 → accuracy is calculated.
Q67. What do you mean by K-Fold Cross Validation technique?
KFold Cross Validation is a method to check how well an AI/ML model works by using the data in k different parts (folds) instead of just one train-test split.
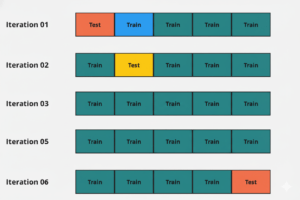
Q68. Explain the Steps of KFold Cross Validation. Explain with example.
1. Divide the dataset into k equal parts (folds).
2. Pick one fold(part) as the test set and use the other (k–1) folds for training.
3. Train the model on training folds, test on the test fold.
4. Repeat this process k times, each time using a different fold as the test set.
5. Take the average of all results → this gives the final performance.
Example (k = 5)
Dataset is split into 5 folds.
Round 1 → Train on folds 1,2,3,4, Test on fold 5.
Round 2 → Train on folds 1,2,3 & 5, Test on fold 4.
Round 3 → Train on folds 1,2 & 4,5, Test on fold 3.
Round 4 → Train on folds 1,2,3,5, Test on fold 2.
Round 5 → Train on folds 2,3,4, 5, Test on fold 1.
Final performance = average of 5 test results.
Q69. What is importance of K-Fold Cross Validation?
- It uses all data for both training and testing.
- It gives a more reliable estimate of model performance than single Train-Test split.
- It reduces risk of overfitting/underfitting.
Q70. Case Study of K-Fold Cross Validation.
Imagine you are building an AI model to predict whether a loan application should be approved or rejected. You have a dataset of 1,000 loan applications (with applicant details + loan approval status). If you do a simple train-test split, maybe 800 records go to training and 200 to testing. But the results may depend too much on which 200 records were chosen for testing.
To avoid this problem, you use 5-Fold Cross Validation:
Split 1,000 applications into 5 folds (200 records each).
Round 1 → Train on 800 records, test on 200 (fold 1).
Round 2 → Train on 800 records, test on fold 2.
Repeat until each fold has been used once as a test set.
Calculate accuracy for each round (say: 85%, 86%, 84%, 87%, 85%).
Final model accuracy = average = 85.4%.
Q71. Name different Classification Evaluation Metrics
- Confusion Matrix
- Precision
- Accuracy
- Recall
- F1 Score
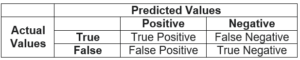
Q72. What is Confusion Matrix?
A confusion matrix is a table that shows how well a classification model is predicting. It is a table that shows actual vs predicted results.
It compares: Actual values (Real values) with Predicted values (Output produced by the model)
Q73. What are different parts of Parts of Confusion Matrix?
- True Positive (TP): Correctly predicted positive. (Actually True, Predicted True)
- True Negative (TN): Correctly predicted negative.(Actually False, Predicted False)
- False Positive (FP): Actually negative but predicted Positive. (Actually False, Predicted True)
- False Negative (FN): Actually positive but predicted Negative (Actually True, Predicted False)
Q74. What do you mean by accuracy of an AI model? What is its significance?
It is defined as percentage of correct predictions out of all the observations.
Accuracy= (TP+TN)/(TP+FN+FP+TN)
Q75. Is accuracy metric sufficient to determine the efficiency of an AI model? Give reason.
OR
Why is accuracy not considered a complete and sufficient metric?
It is not sufficient to determine the efficiency of an AI model because it may give misleading results if training data is not balanced.
Q76. What do you mean by precision of an AI model? What is its significance?
It is defined as the proportion of positive predictions out of all the observations that are positive(correct or incorrect). Its value lies between 0 and 1. Precision helps us to visualize the reliability of the machine learning model in classifying the model as positive.
Precision= TP/(TP+FP)
An AI model with high precision is considered trustworthy.
Q77. What is recall?
It is a metric that indicates that out of all actual positive values, how many are predicted positive. Its value lies between 0 and 1. Recall measures the model’s ability to detect positive samples.
Recall= TP/(TP+FN)
Q78. What is F1 score? What is its significance?
It is a metric that balances precision and recall. Its value lies between 0 and 1.
Recall= 2X(Precision X Recall)/(Precision +Recall)
Q79. Where is F1 score useful?
F1 score is useful when we need to compare two or more classification-based AI models for the same data. The AI model with higher F1 score is preferred.
Q80. Suppose 100 patients are tested for Covid : Create confusion Matrix. Also calculate Accuracy, Precision, Recall and F1 Score.
- 60 actually have COVID (Positive cases)
- 40 do not have COVID (Negative cases)
The AI model predicts:
- 50 sick patients correctly identified → TP = 50
- 10 sick patients missed (said healthy) → FN = 10
- 5 healthy patients wrongly marked as sick → FP = 5
- 35 healthy patients correctly identified → TN = 35
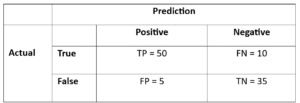
Accuracy = (TP + TN) / Total = (50+35)/100 = 85%
Precision = TP / (TP+FP) = 50 / (50+5) = 90.9%
Recall (Sensitivity) = TP / (TP+FN) = 50 / (50+10) = 83.3%
F1 Score =
=2×(0.909×0.833)/(0.909+0.833)
=2×0.757/1.742
=2×0.4346
=0.869 or 86.9%
Q81. What do you mean by Regression Evaluation Metrics?
When we build a regression model (e.g., predicting house prices), we need to check the difference between predictions and actual values. These are measured using error metrics as follows:
- Mean Absolute Error (MAE)
- Mean Squared Error (MSE)
- Root Mean Squared Error (RMSE)
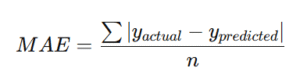
Q82. Explain Mean Absolute Error (MAE).
It is defined as Average of the absolute differences between actual and predicted values. It tells us how much error, on average, the model makes (in same units as data).
Formula:
Example:
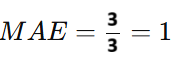
Suppose Actual values are = [3, 5, 7]
Predicted Values are = [2, 6, 6]
Errors(Actual-Predicted) = |3–2| + |5–6|+ |7–6| = 1 + 1 + 1 = 3
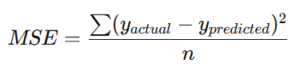
Q83. Explain Mean Squared Error (MSE).
It is defined as Average of the squared differences between actual and predicted values.. It Penalizes larger errors i.e. small mistakes (like 1 or 2 units off) don’t matter much but Big mistakes (like 10 or 20 units off) become much bigger after squaring.
Formula:
Example:
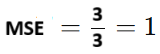
Suppose Actual values are = [3, 5, 7]
Predicted Values are = [2, 6, 6]
Errors(Actual-Predicted) = Errors = (3–2)² + (5–6)²+ (7–6)² = 1² + (–1)²+ (1)² = 1 + 1 +1 = 3
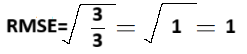
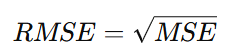
Q84. Explain Root Mean Squared Error (RMSE).
It is defined as Square root of MSE. It gives error in the same units as the original data (easier to interpret).
Formula:
Example:
Suppose Actual values are = [3, 5, 7]
Predicted Values are = [2, 6, 6]
in the previous question, value of MSE is 1. So square root of 1 is also 1